Figure 1. The Earth doesn’t always rotate at the same speed and this seems to be related to the climate
NASA shows the Moon in the same picture, but it’s far away, so the scale is wrong. The Moon’s diameter is a quarter of the Earth’s.
Kjell Lindmark has dug deep into the extensive facts that professor Ole Humlum provides at his blogg ”climate4you”. (Translation by Kevin Benn)
+-+-+-+-+-+
The mean global temperature, as we know, has risen since the pre-industrial period. According to the UN’s climate panel IPCC, it’s the fault of industry that we have left the Little Ice Age behind us and are now experiencing a milder climate. There are, however, different views as to how much the global temperature has risen, ranging from 0.8 – 1.2⁰C. The reason for this rise in temperature is also uncertain. In fact, the reason is unknown, but the rising level of CO₂ in the atmosphere has been blamed for the warming.
The reason is uncertain because the climate is a chaotic system like a saucepan of boiling water. You can’t tell beforehand how the water will move when it’s heated, only that it does so. There are many different parameters to account for such as ocean currents, cloudiness, solar radiation, IR radiation, the Milankovitch cycles, volcanic eruptions and so on.
There’s one more parameter: it has to do with the speed of the Earth’s rotation. This changes irregularly. One measures the Earth’s astronomical rotation, LOD, (Length of Day) which can vary by a mere -4 to +4 milliseconds per day. This is very small, yet it follows the Earth’s mean temperature. This parameter doesn’t completely explain the temperature changes, but it follows the trend of rising and falling mean temperatures.
The figure below shows the the relationship from 1850 to the present day. With slower Earth rotation it’s warmer, and vice versa. Which is cause and which is effect is uncertain.
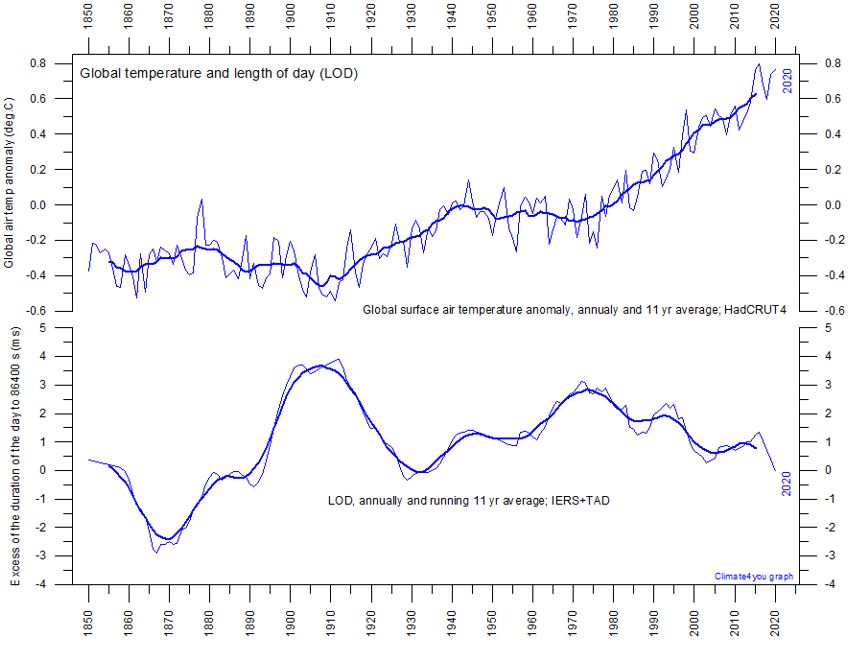
Figure 2. Global temperature, upper panel, and length of day, LOD, 1850 – 2020.
The lower panel shows the deviation in milliseconds from the normal LOD, 86,400 seconds.
The next figure shows a more detailed picture, from 1962 to today.
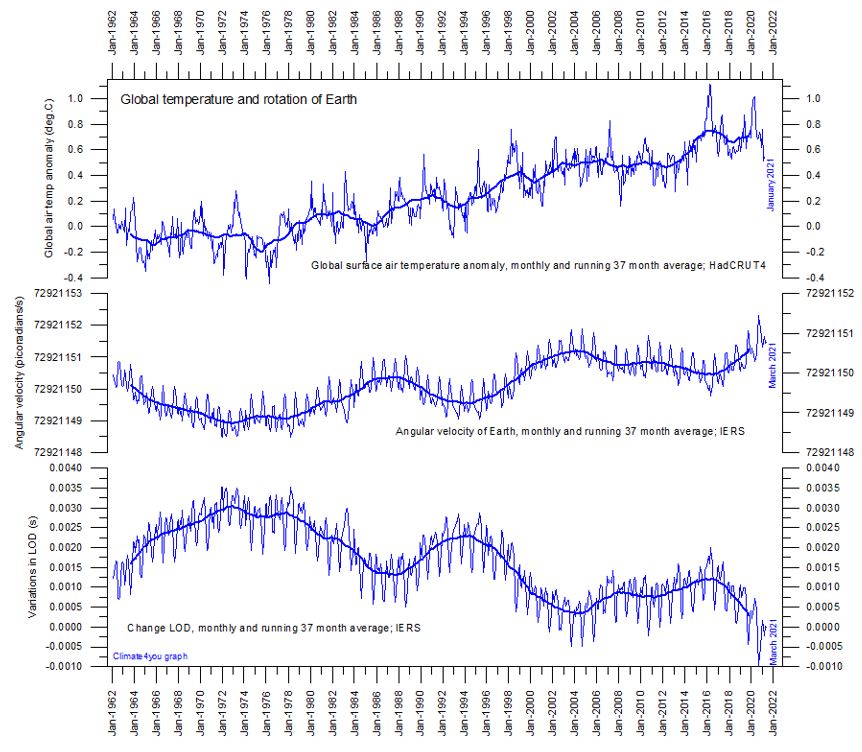
Figure 3. Global temperature, speed of rotation and LOD 1962 – 2021
- The upper panel shows the global mean temperature anomaly in degrees C
- The middle panel shows the angular velocity in pico radians per second
- The lower panel shows the Length of Day anomaly in seconds or rather milliseconds
The two lower panels show each other’s inverted values.
It remains to be seen whether the cooling of the past three months is reflected in the speed of rotation in coming graphs.
As we said, this doesn’t explain the changes in temperature, but it is an interesting part of the whole picture, and shows how complicated this is.
Kjell Lindmark
+-+-+-+-+-+
The moment of inertia of the planet is a measure of the torque required to change the speed of rotation. When the oceans warm, the water expands such that its mass acquires a longer radius to the axis of rotation. This increases the moment of inertia. Since no external force is affecting the rotation, the planet slows down.
On the other hand, if the Himalayan glaciers melt, so that their mass ends up in the ocean, the radius – and thus the moment of inertia – will diminish and the rotation will become faster.
But, when the Earth slows down, there is nothing giving the ocean’s currents a push to the left or right. The Gulf Stream flows along in the Universe in the usual manner, whereas Norway moves less to the East. In relation to the land, the Gulf Stream moves eastwards. In the worst case it hits Portugal and turns south, so that Scandinavia gets a new Ice Age. . .
There’s a lot to keep track of, which is why I think the IPCC’s ”climate model predictions” will always be way off.
S.Å.
+-+-+-+-+